Aditya Rastogi, PhD

Post Doctoral Researcher, Department of Neuroradiology
Universitätsklinikum Bonn, Germany
PhD, Medical Imaging Group
Department of Computational and Data Science
Indian Institute of Science
B.Tech, Mechanical Engineering
Delhi Technological University
2012-2016
DS200:Research Methods
Module 4 : Assignment
AIM:- To download a dataset from www.data.gov.in and do the following
Make a scatterplot, barchart and boxplot and draw inferences from it.
Part1: - Dataset
The dataset is [1] Crime in India - 2009/State/UT-wise Complaints received by Police & Cases registered under IPC & SLL during 2009 and is downloaded from www.data.gov.in.
The link to download the dataset is here .
The data is uploaded by National Crime Records Bureau- Ministry of Home Affairs (http://ncrb.gov.in/).
The data gives the statistics of the method of complaint registration (oral/written/helpline/suomoto by police) and the category in which complaint is registered (IPC or SLL)
Part2: - Scatter Plot
Below are two scatterplot.
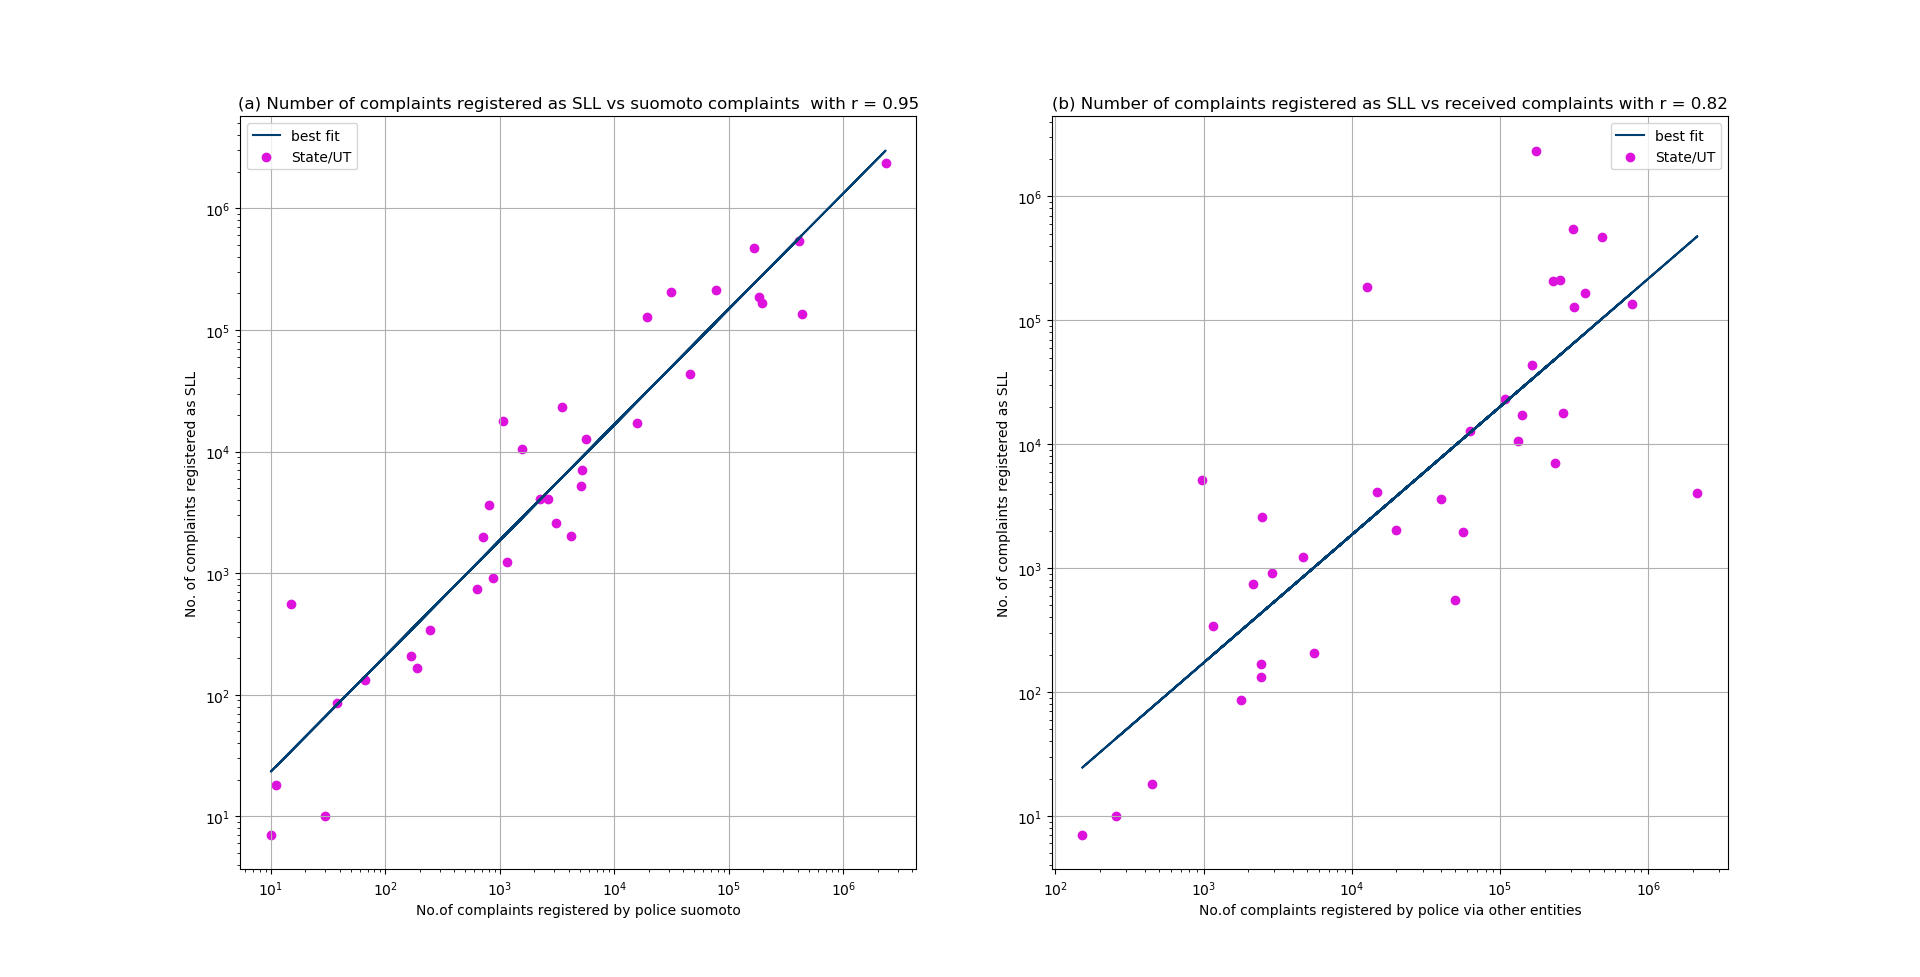
- The plot on left has Number of complaints registered suomoto by police -i.e The cases registered by police based on their investigation - vs Number of complaints registered as SLL (SLL:- Special and Local Laws, these are laws which are not part of IPC and include law instituted by Acts like Gambling Act 1867, Forest Act 1927, etc) for 28 states (based on 2009 data) and 7 union territories of India.
- The plot on the right has Number of complaints registered to police by oral,written or via helpline vs Number of cases registered as SLL for 28 states (based on 2009 data) and 7 union territories of India.
- Both the x-axis and y-axis are on log10 scale. Best fit line is also plotted in each scatter plot.
- r denotes the correlation coefficient between the data on x-axis and y-axis.
The observations one can derive from the scatterplot are the following:-
- The number of complaints registered suomoto by the police for a state/UT are highly correlated with the number of complaints filed under SLL.
- The correlation between number of complaints registered by others(not suomoto by police) are not correlated to the number of complaints filed under SLL to that extent.
- The regression line in plot (a) fits the data better than in plot (b).
- A logical reason for this is that mostly complaints under Special and Local Laws are filed againsts an entity after investigation by law enforcers and are therefore not filed on recieving of first complaint (with few exceptions like cognizible crime under Dowry Actor SC/ST attrocity ACT).
Part2: - Box Plot
Below are two boxplots.
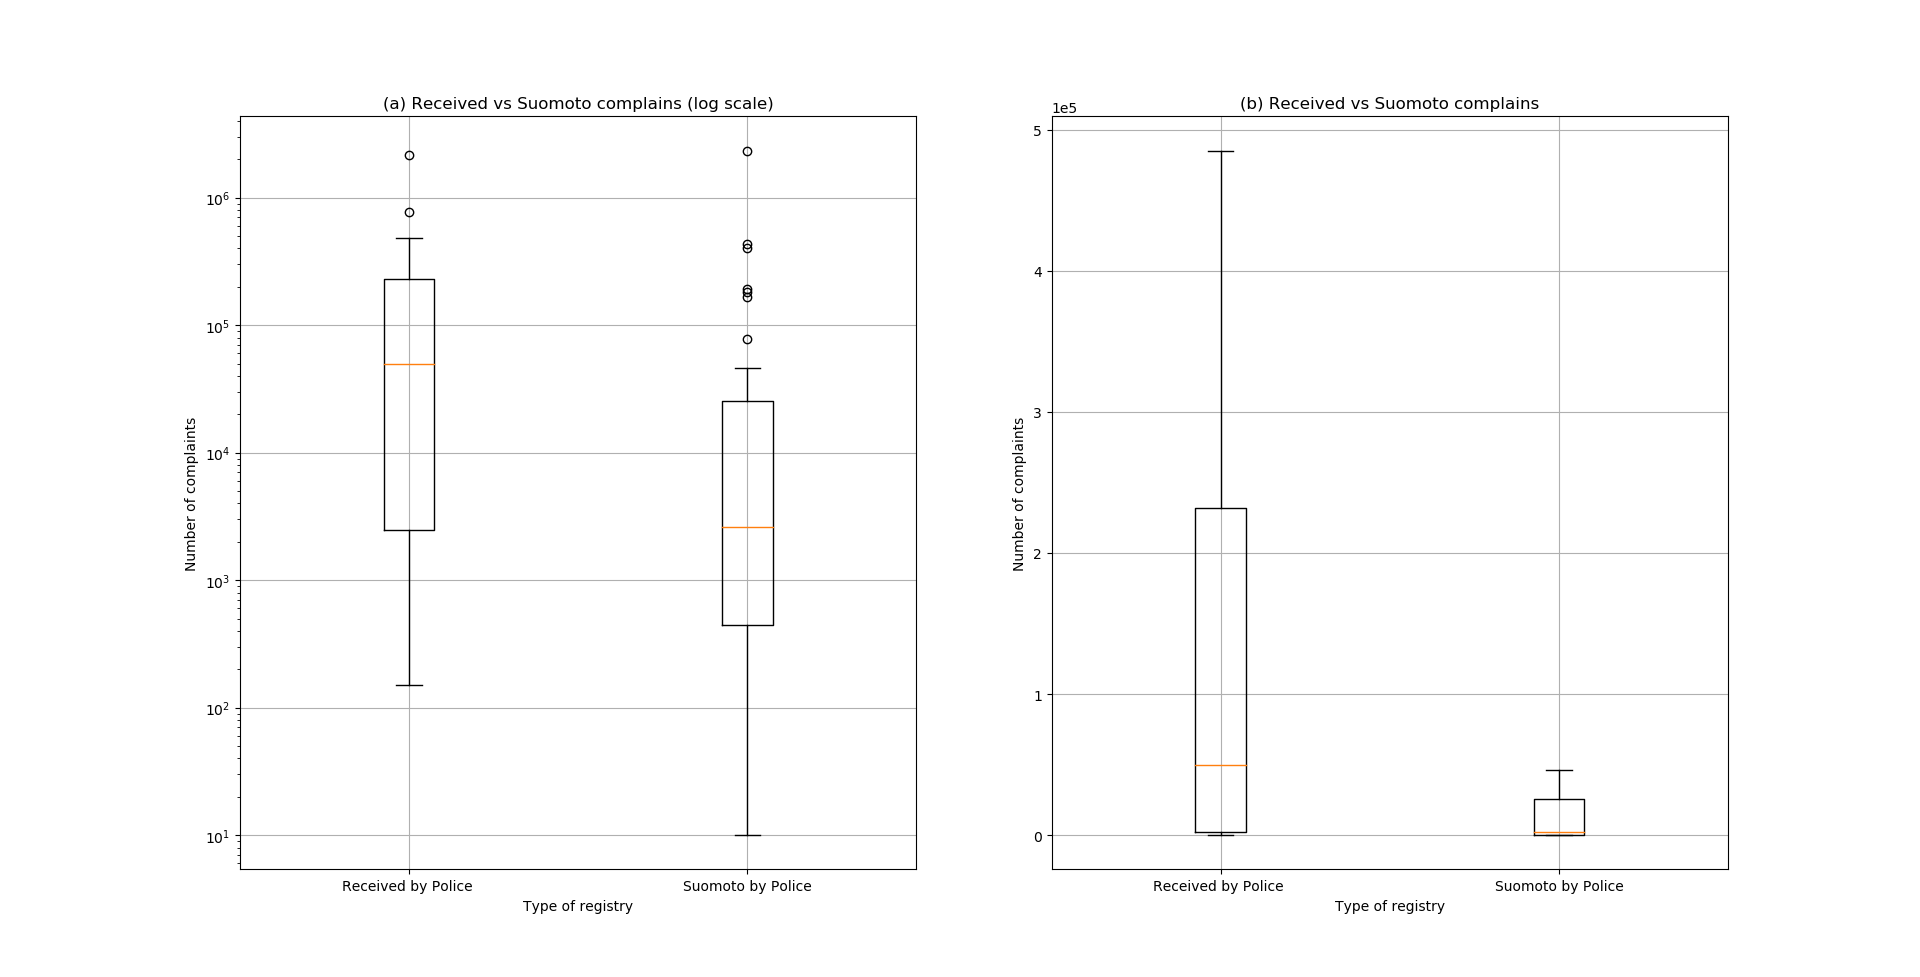
- The plot on the left shows the box plot of Number of complaints received by police in two catergories. First the complaints which are submitted to police by other entities via oral,written means or using police helpline for all 35 states and U.Ts. Second are the complaints that are registered by police suomoto for all 35 states and U.Ts. The first boxplot shows the number of complaints on log scale along with the outliers.
- The second boxplot shows the same data as (1) but on a linear scale without outliers.
The observations one can derive from the boxplots are the following:-
- Looking at (b) we can say that on an average more complaints are registered by outside entities than suomoto by law enforceres.
- The spread in number of complaints filed by non law enforcers is more. This category also has less outliers than the other.
- The complaints registered suomoto by law enforcers are very high compared to the IQR in a few States/UTs and hence have more outliers.
Part3: - Bar Chart
Below is the Barchart which shows for all States and U.Ts (those that existed in 2009) how many complaints are filed by non law enforcers and suomoto by police.
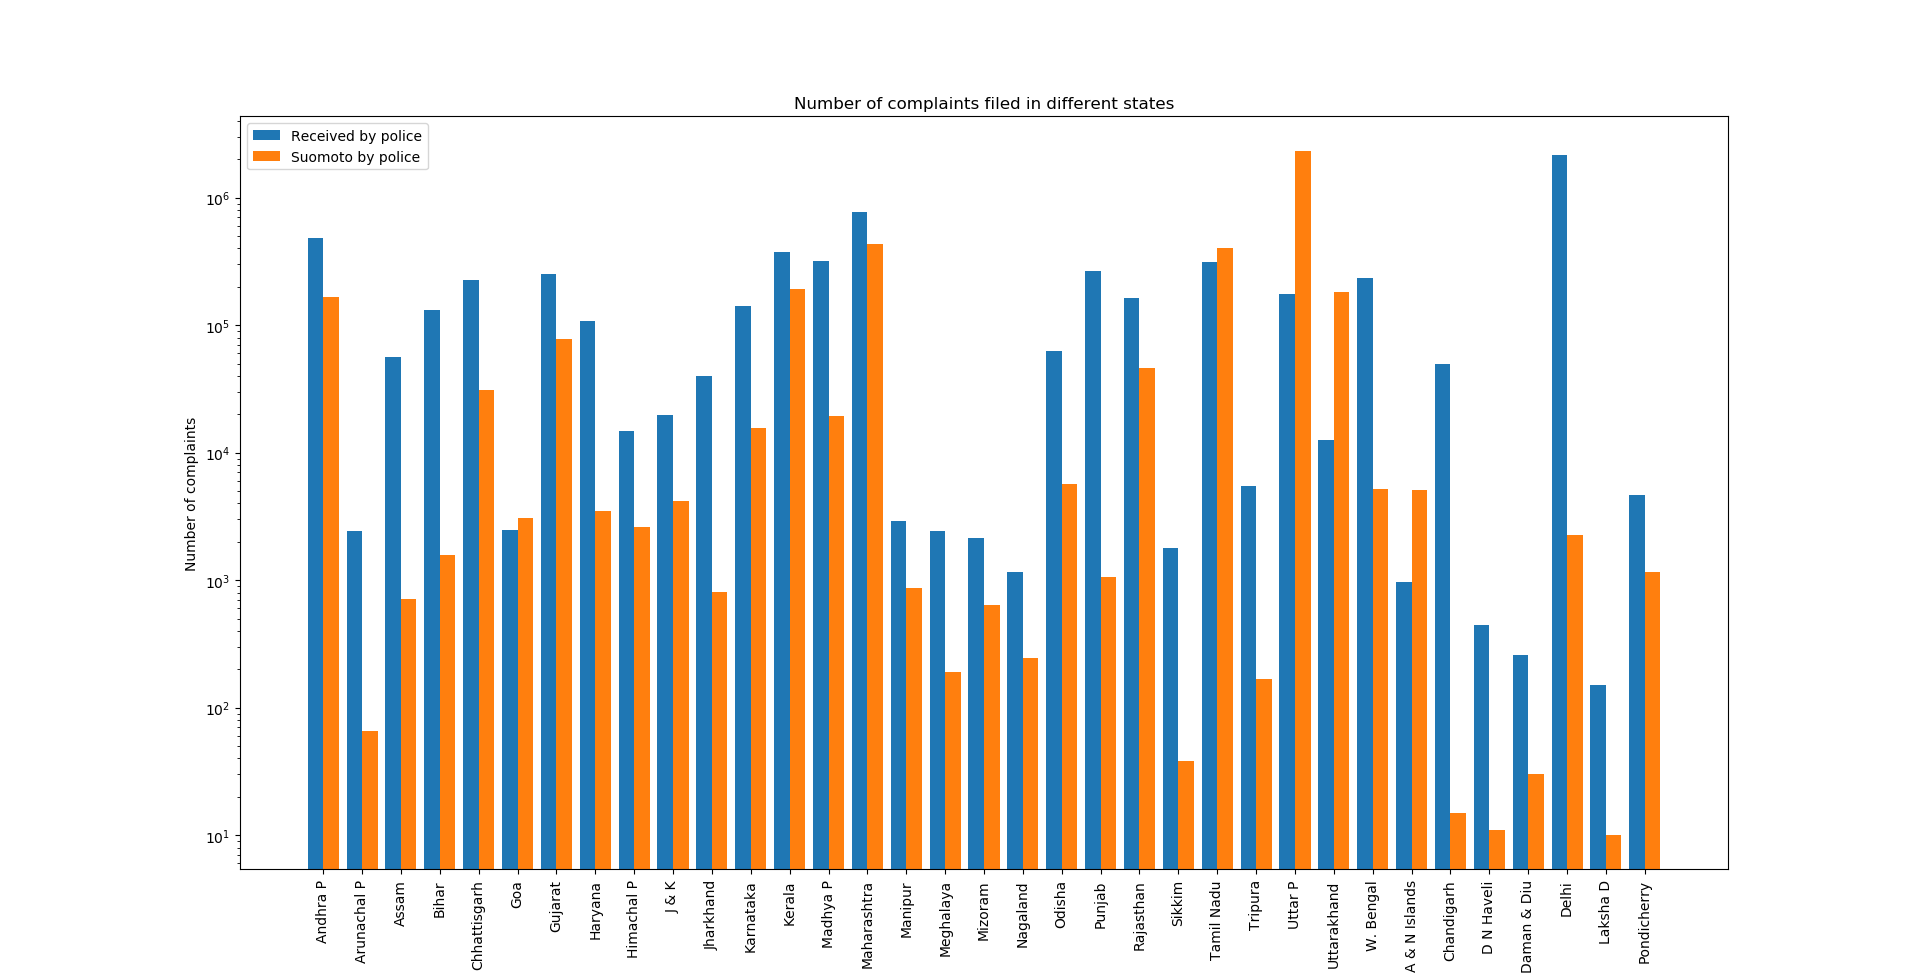
- The Bar chart shows on log10 scale the number of complaints. The blue bar denoted the number of complaints received by police via oral/written/helpline and the red bar denoted the number of complaints filed suomoto by police for all 35 states and U.Ts .
The observations one can derive from the bar chart are the following:-
- Apart from T.N, A&N Islands and Uttarakhand in all states more complaints are recieved via oral/written/helpline means. This explains the higher average of number of complaints received via oral/written/helpline means in box plot.
- Although in most of states the number of suomoto complaints are considerably less than the other category, in some of them the number is closer or even higher than later. This explains the reason for high number of outliers.
References
[1]. National Crime Records Bureau,2009, State/UT-wise Complaints received by Police & Cases registered under IPC & SLL during 2009, electronic dataset,Open Government Data (OGD) Platform India, https://data.gov.in/resources/stateut-wise-complaints-received-police-cases-registered-under-ipc-sll-during-2009.